Open source · MIT license · Self-hosted

Your whole homelab on a single page

Server Dashboard brings your services, your server's health, your Docker containers and your media together in a lightweight dashboard you host yourself. One Docker command is all it takes.
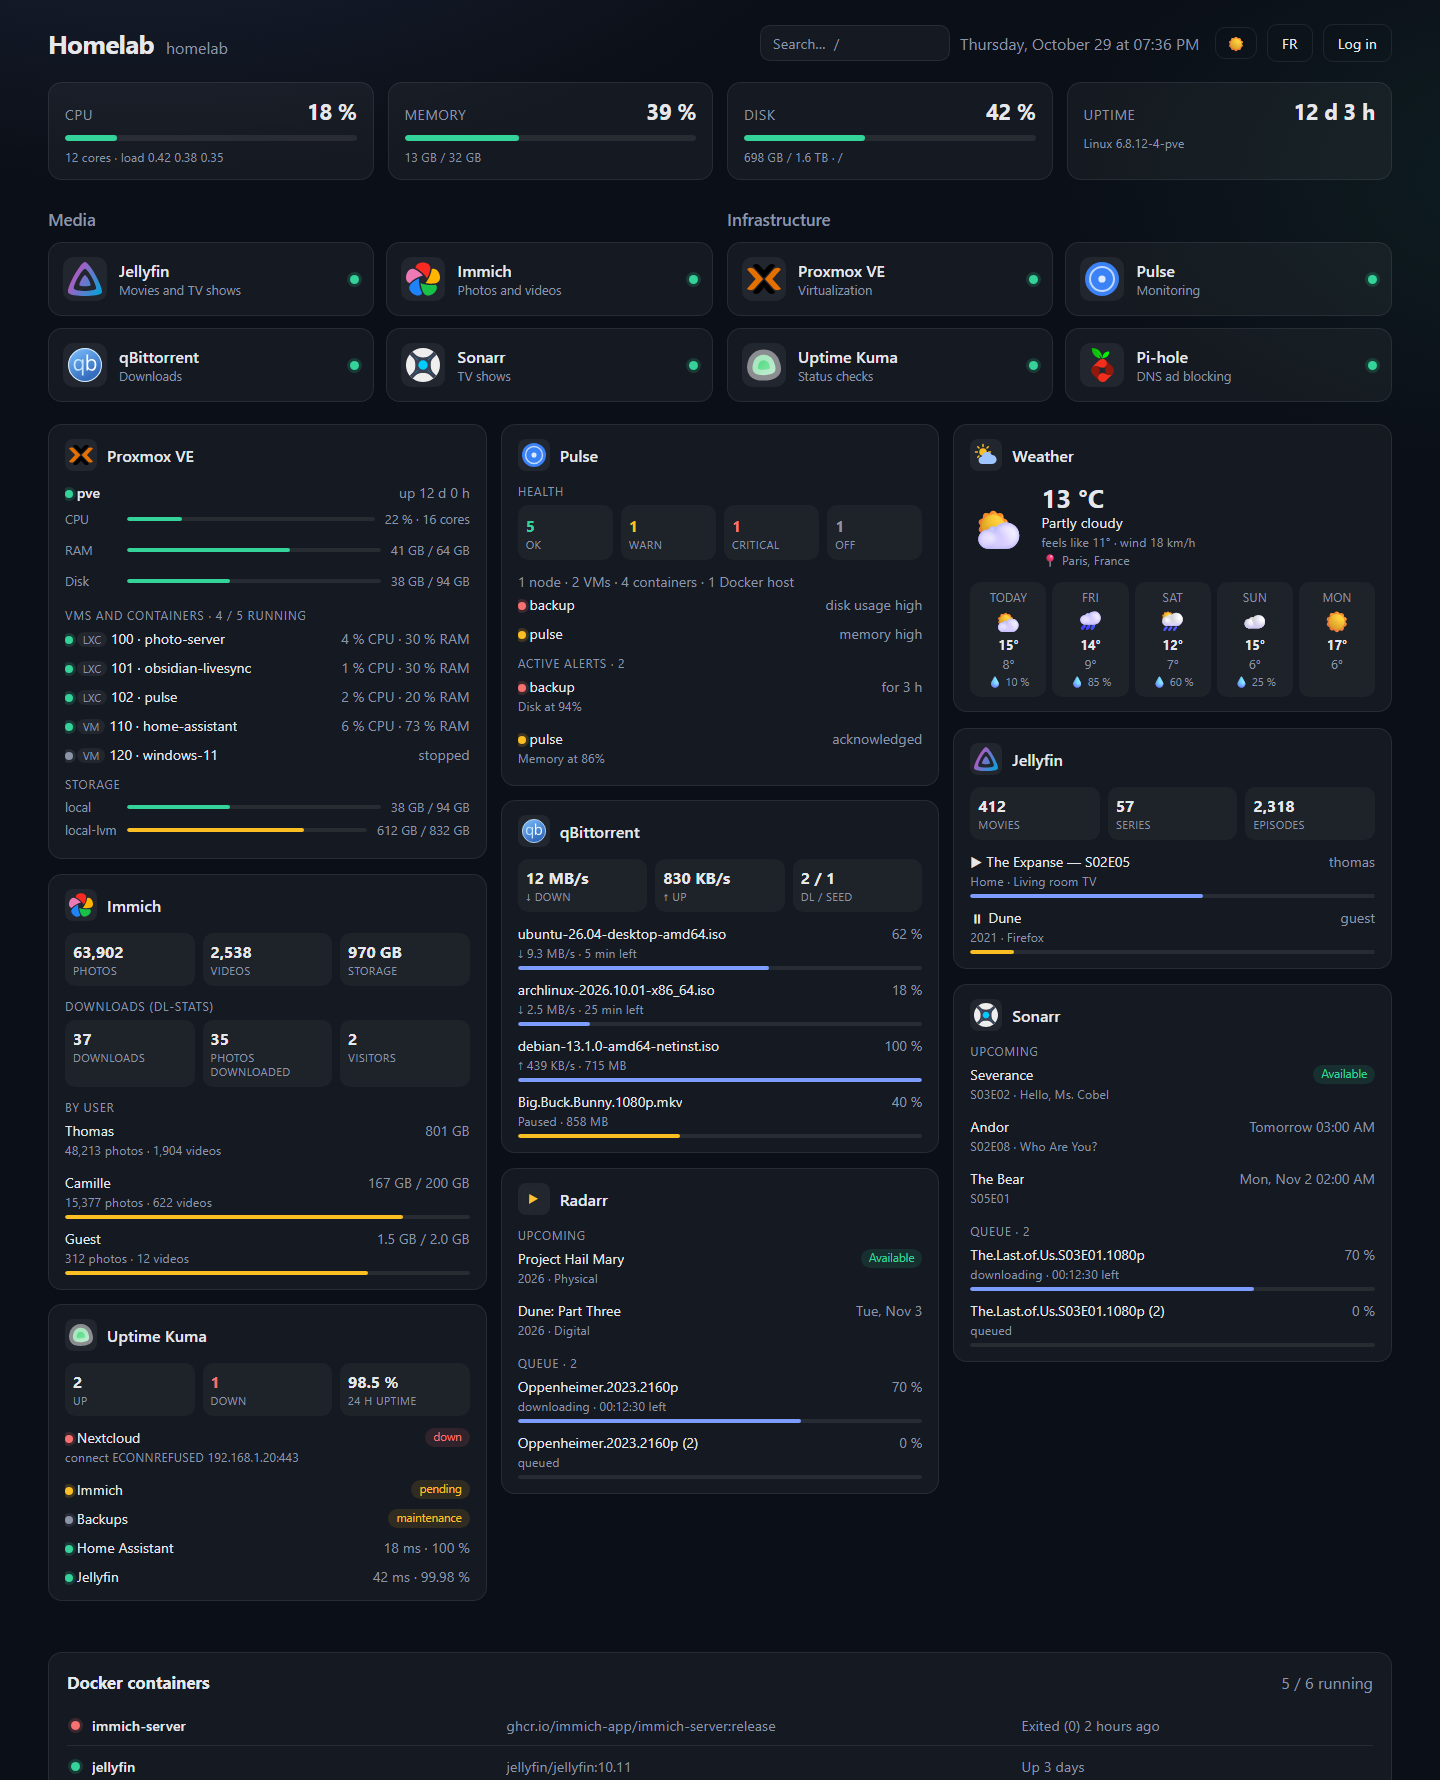
The dashboard: CPU, memory and disk stats, app tiles, Proxmox VE, Pulse, Weather, Immich, qBittorrent, Jellyfin, Sonarr, Radarr and Uptime Kuma widgets, and the Docker container list

What it does

The essentials of a homelab dashboard, with no database and no build step. A single Docker image.

App tiles

Your services grouped by category, with their icons and an online / offline indicator checked by the server.

Server stats

Live CPU, memory, disks and uptime, color-coded as soon as a resource runs low.

Docker control

Your containers and their state. Start, stop or restart them in one click once logged in.

No config files to edit

Add, edit and reorder your apps with drag and drop, right in the password-protected interface.

Secrets stay server-side

Your API keys and passwords stay on the server: they are never sent to the browser.

Light and readable

Node.js + Express and framework-free HTML/CSS/JS. Easy to read, change and extend.

Widgets for your services

Connect your apps and keep an eye on what's happening without opening ten tabs.

Proxmox VE Pulse Jellyfin Plex qBittorrent Sonarr Radarr Immich Pi-hole AdGuard Home Home Assistant Uptime Kuma Frigate CrowdSec Wazuh Traefik
  • Proxmox VE: host CPU, RAM and disk, and the state of every VM and LXC container.
  • Pulse: overall health, active alerts, nodes / VMs / LXC, as blocks you can place anywhere.
  • Jellyfin and Plex: who is watching what, on which device, with progress.
  • qBittorrent: speeds, active torrents and time left.
  • Sonarr and Radarr: upcoming episodes and movies, download queue.
  • Pi-hole and AdGuard Home: DNS queries, blocked queries and protection status.
  • Immich: photos, videos and storage, per user with quotas.
  • Weather: current conditions and a 5-day forecast, no API key (Open-Meteo).
  • Home Assistant and Frigate: your sensors and entities, cameras and the latest events.
  • Security with CrowdSec, Wazuh and Traefik: attacks and banned addresses, agents and security alerts, failing routers.
  • And over 30 widgets in all: Uptime Kuma, Nginx Proxy Manager, Speedtest, Scrutiny, RSS feeds, calendar… and the widget you suggest.
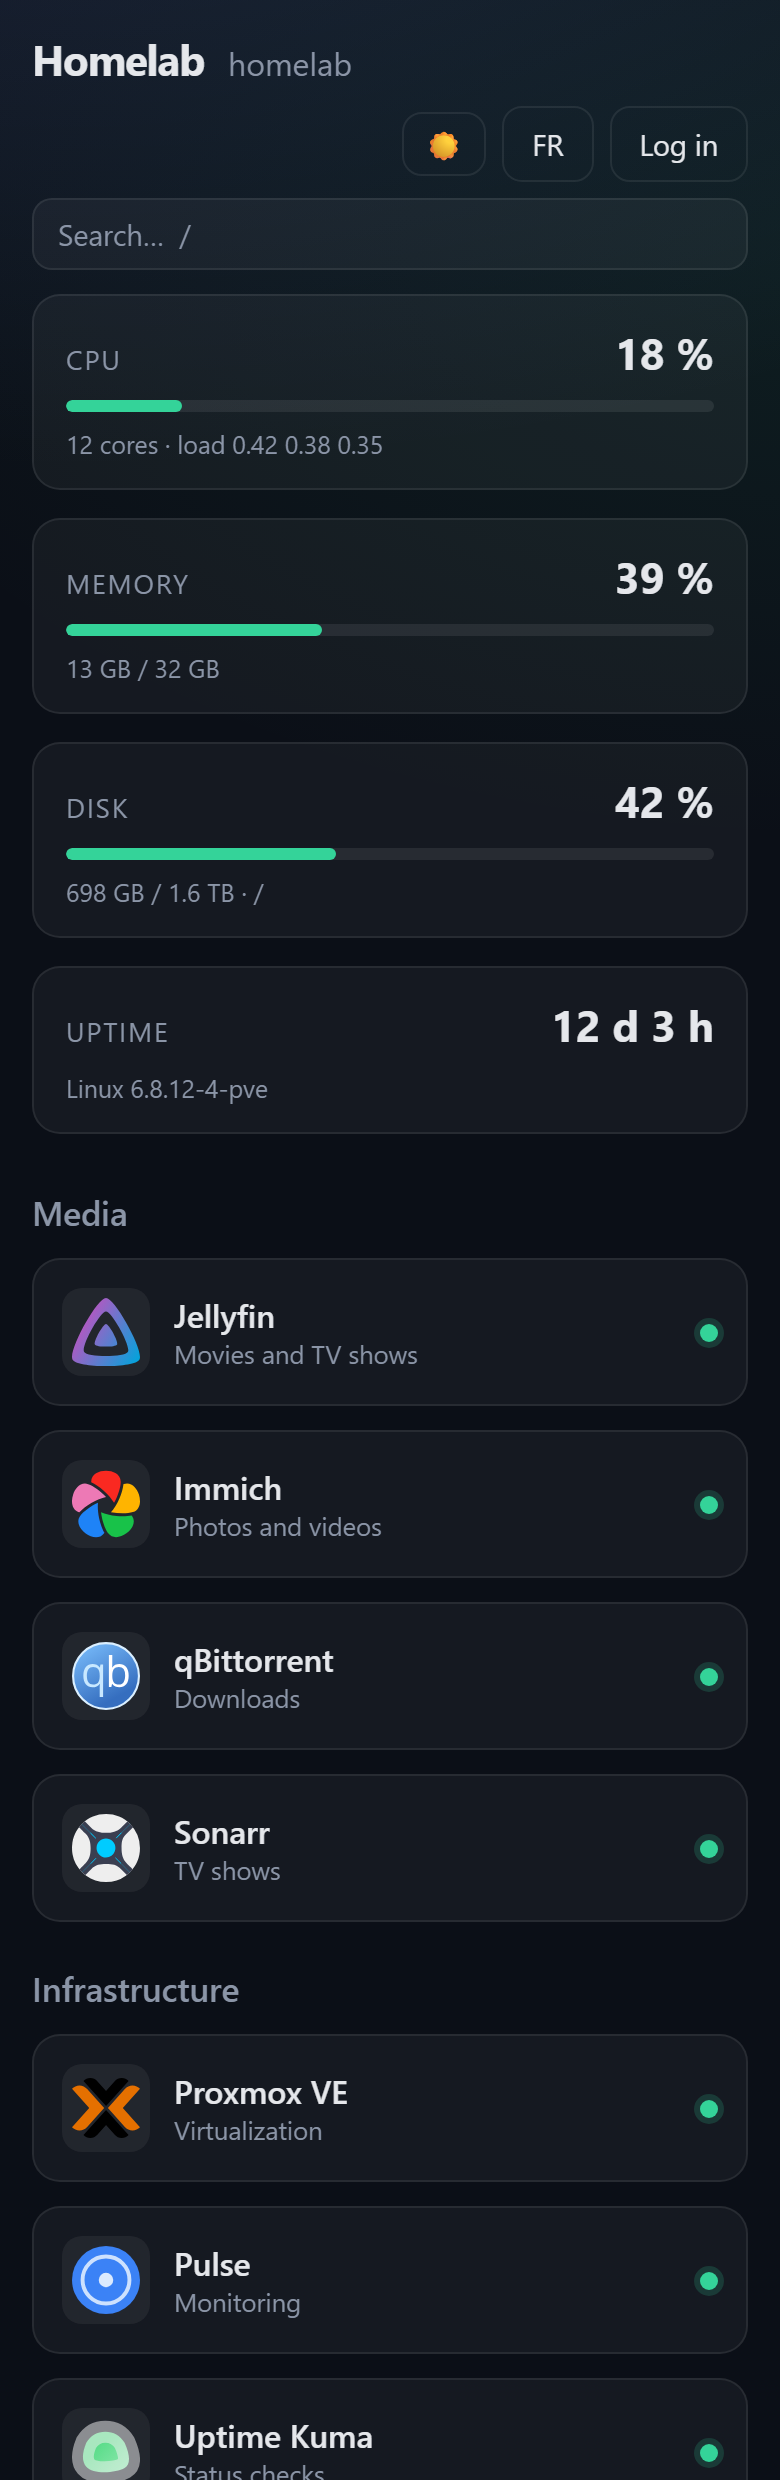
The dashboard on a phone: server stats and app tiles

Installation

On any Linux server: VPS, Raspberry Pi, Proxmox LXC container, NAS…

Without Docker, in one command

Debian 12+ or Ubuntu 22.04+. Installs Node.js if needed, creates a systemd service and prints your admin password. Run the same command again to update.

curl -fsSL https://raw.githubusercontent.com/Circule-studio/server-dashboard/main/packaging/install.sh | sudo bash

With Docker

Get the configuration

mkdir server-dashboard && cd server-dashboard
curl -fsSLO https://raw.githubusercontent.com/Circule-studio/server-dashboard/main/compose.yaml
curl -fsSL https://raw.githubusercontent.com/Circule-studio/server-dashboard/main/.env.example -o .env

Choose your admin password

nano .env   # replace "change-moi"

Start it

docker compose up -d

Then open http://SERVER-IP:7575: a welcome screen guides you. The image is built for amd64 and arm64 (Raspberry Pi).

Roadmap

Where the project stands and what's coming. Each item is a GitHub issue: pick one and dive in!

Versions 0.1 – 0.22

Available
  • App tiles with online status
  • CPU, memory, uptime and multiple disks
  • Docker panel
  • Proxmox VE and Pulse widgets
  • Jellyfin, Plex, qBittorrent, Sonarr, Radarr widgets
  • Weather, Immich, Pi-hole and AdGuard Home widgets
  • Light theme and quick search (/ key)
  • Layout grid and drag and drop, touch included
  • Phone-friendly interface
  • GitHub, Uptime Kuma, Home Assistant, Frigate and Nginx Proxy Manager widgets
  • GoAccess, Alwaysdata, RSS / Atom feed and iCal calendar widgets
  • Proxmox Backup Server, Scrutiny, Speedtest Tracker, Lidarr, Readarr, Prowlarr, Bazarr and custom API widgets
  • CrowdSec, Wazuh and Traefik security widgets
  • Tile status from another address or a ping, with the response time
  • Tabs and collapsible categories
  • Tiles linked to a VM, LXC or container (CPU and RAM)
  • Several machines on the same dashboard (Glances or agent)
  • ntfy, Gotify, Discord or webhook notifications when an app goes down, a VM stops, a disk fills up or an attack is detected
  • Catalog of well-known apps and tile sizes
  • Configuration export and import
  • Docker (amd64 / arm64 image) or systemd install
  • Welcome screen on first launch
  • Interface and website in English and French

Missing an idea? Suggest it in an issue.

Let's build it together

The project is young and looking for contributors, especially on the interface: light theme, mobile layout, new widgets. Fake services (npm run mocks) let you test everything without installing anything.